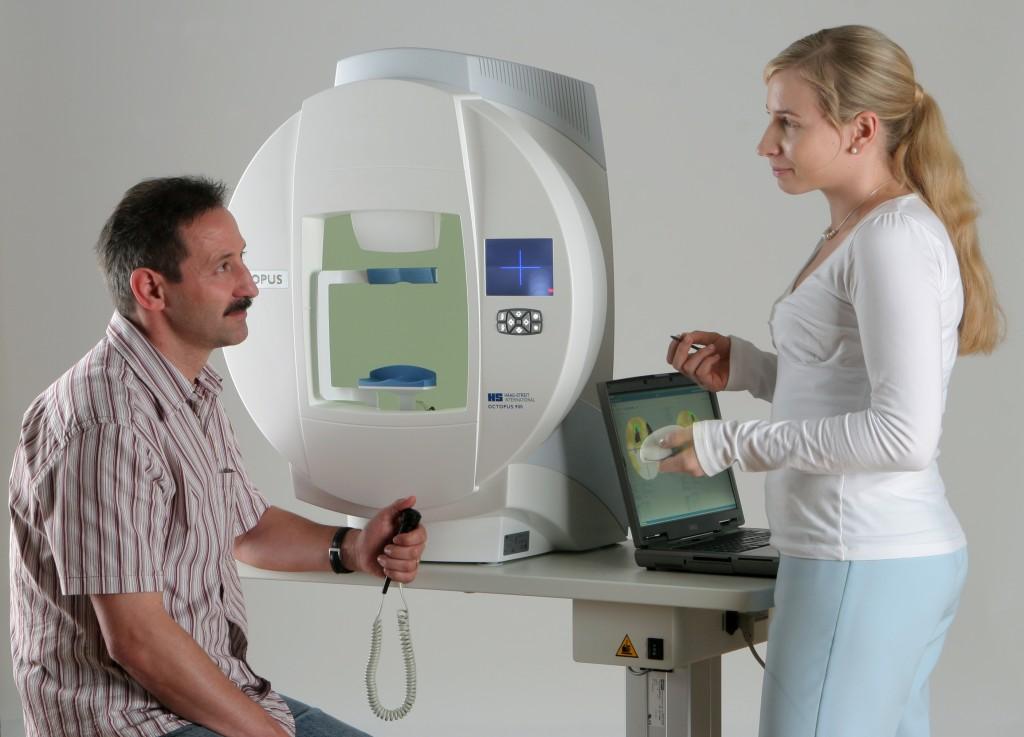
Haag Streit LENSTAR® - Operation

Perimetry
Click on images to enlarge for better viewing.
Running an Examination Step-by-Step
Only trained personnel are permitted to operate the LENSTAR® and OCTOPUS® - additional application hints can be found in the handbooks.
Visual Field Test:
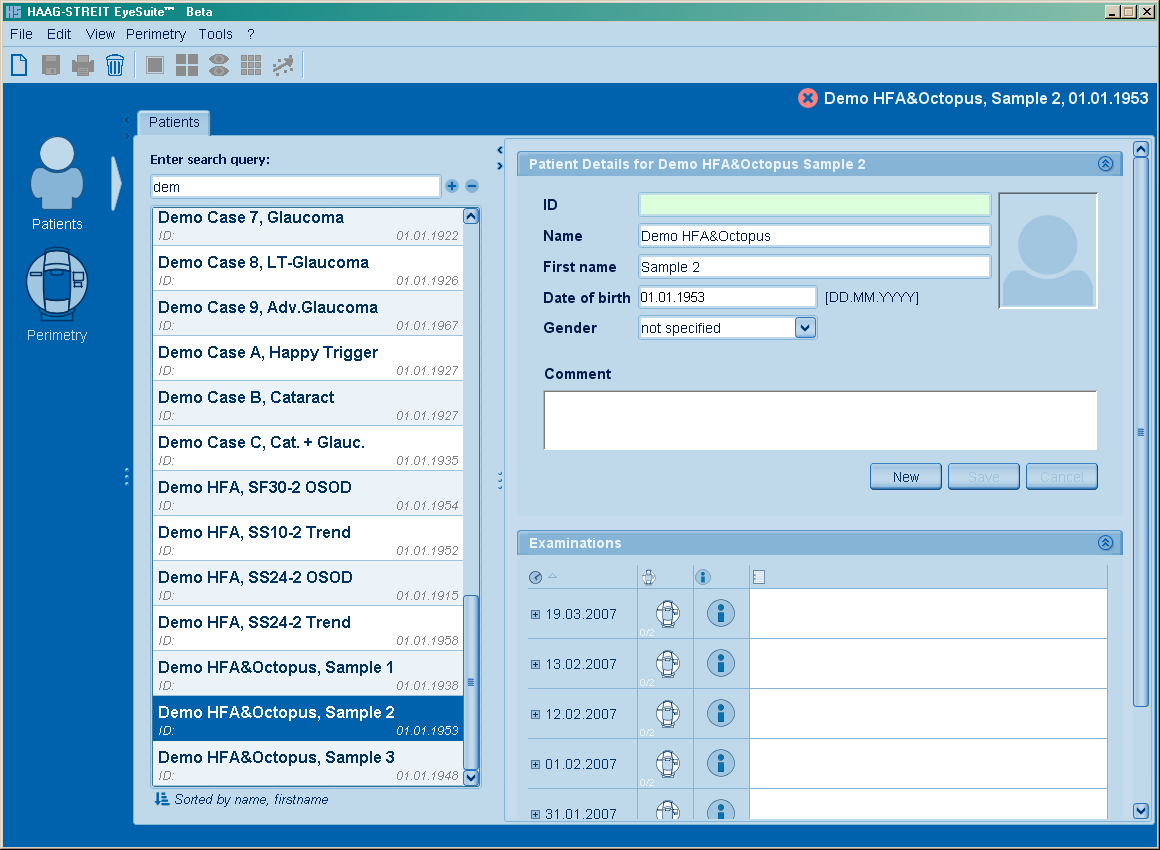
Select a patient
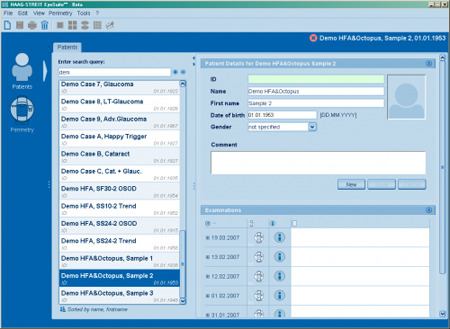
- Under "Patients" (top left icon) select an existing patient or enter a new one according to Data_management
- Click on the "Perimeter" icon to the left
Select a Visual Field Test
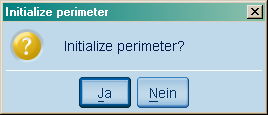
- If the perimeter has not yet been initialized since it has been turned on (e.g. before the first examination in the morning) it will ask to be initialized.
- Turn off the room lights and click "Yes" to initialize the perimeter.
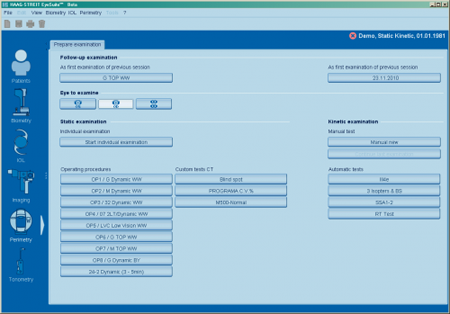
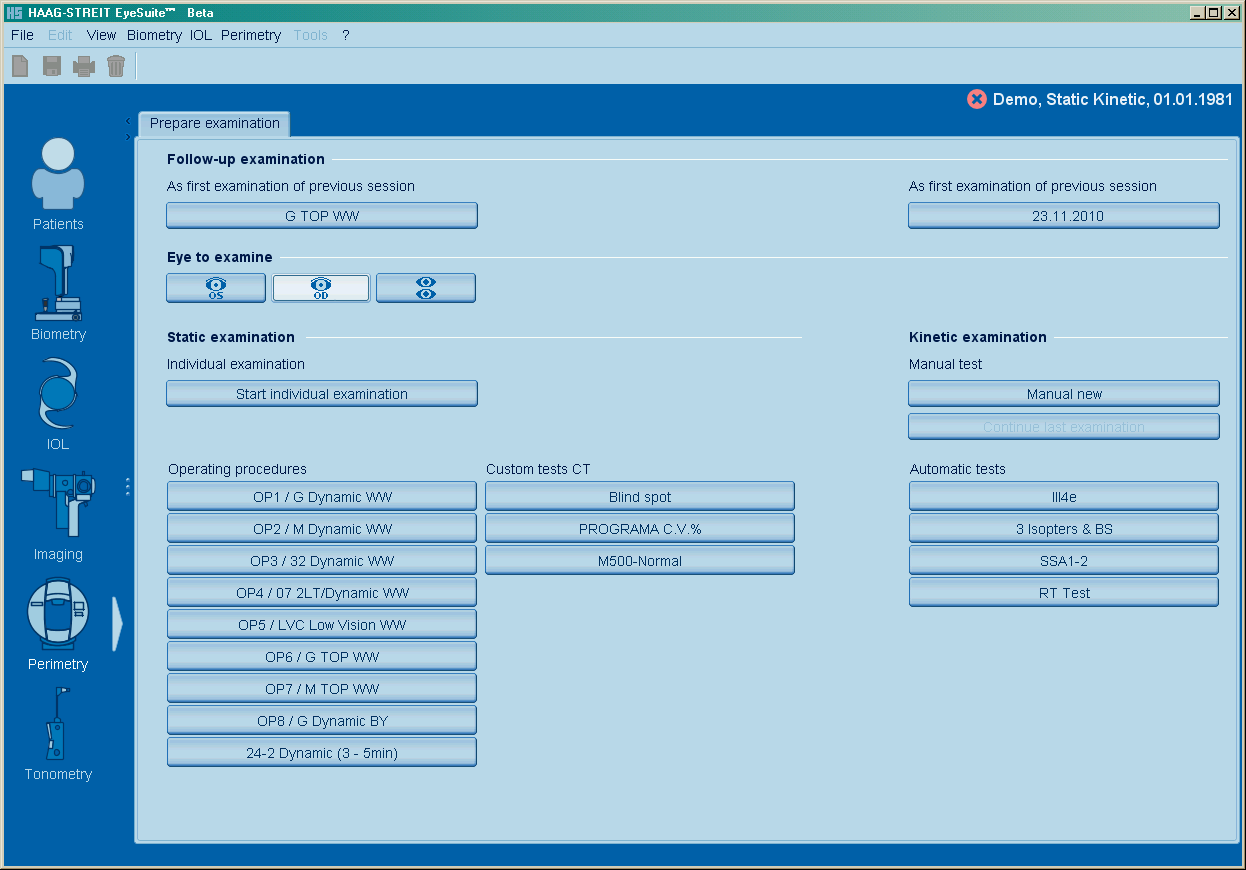
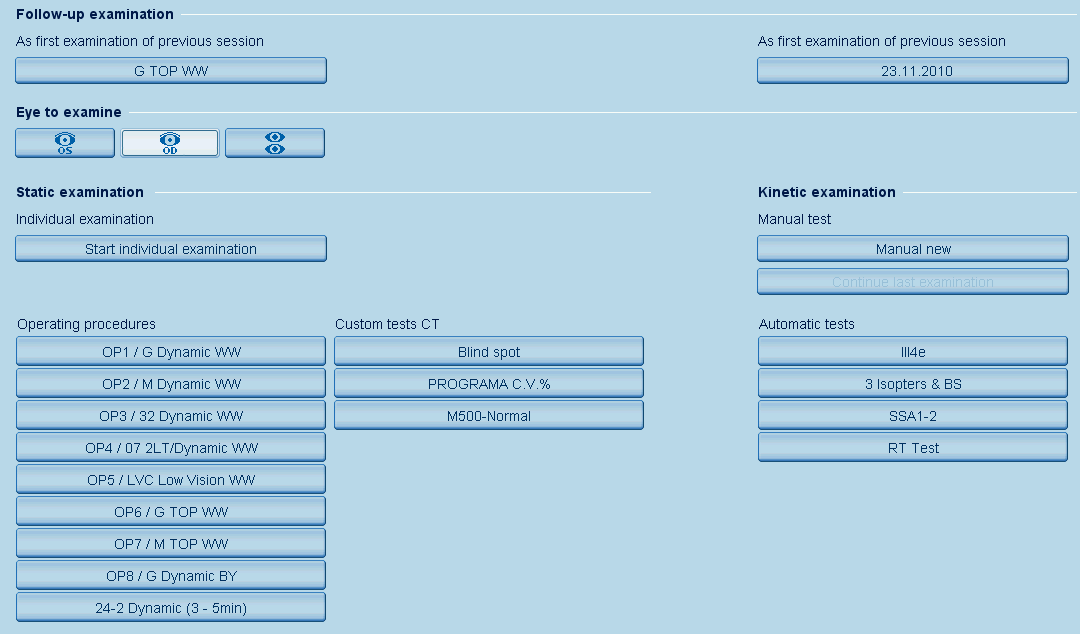
- If the patient has performed previous visual field tests, you can click the button under "Follow-up examination" to run the same procedure as during the last visit. This button exists for static and for kinetic Goldmann perimetry.
- If the patient has no visual fields yet or you want to run a different test, select the eye that first shall be tested (OD for right eye, OS for left eye, "2 eyes" for binocular testing) and select a predefined operating procedure (static perimetry) or automatic test (Goldmann kinetic perimetry). In case you want to run an individual test, use the respective button in either static or kinetic perimetry.
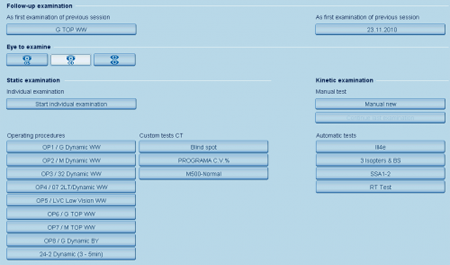
The most frequently used tests are found under "Operating procedures" (in Goldmann kinetic under "Automatic tests"). Click on the desired test button, or if the requested test is not listed, click "Start individual examination" to select the test.
Perform the Examination
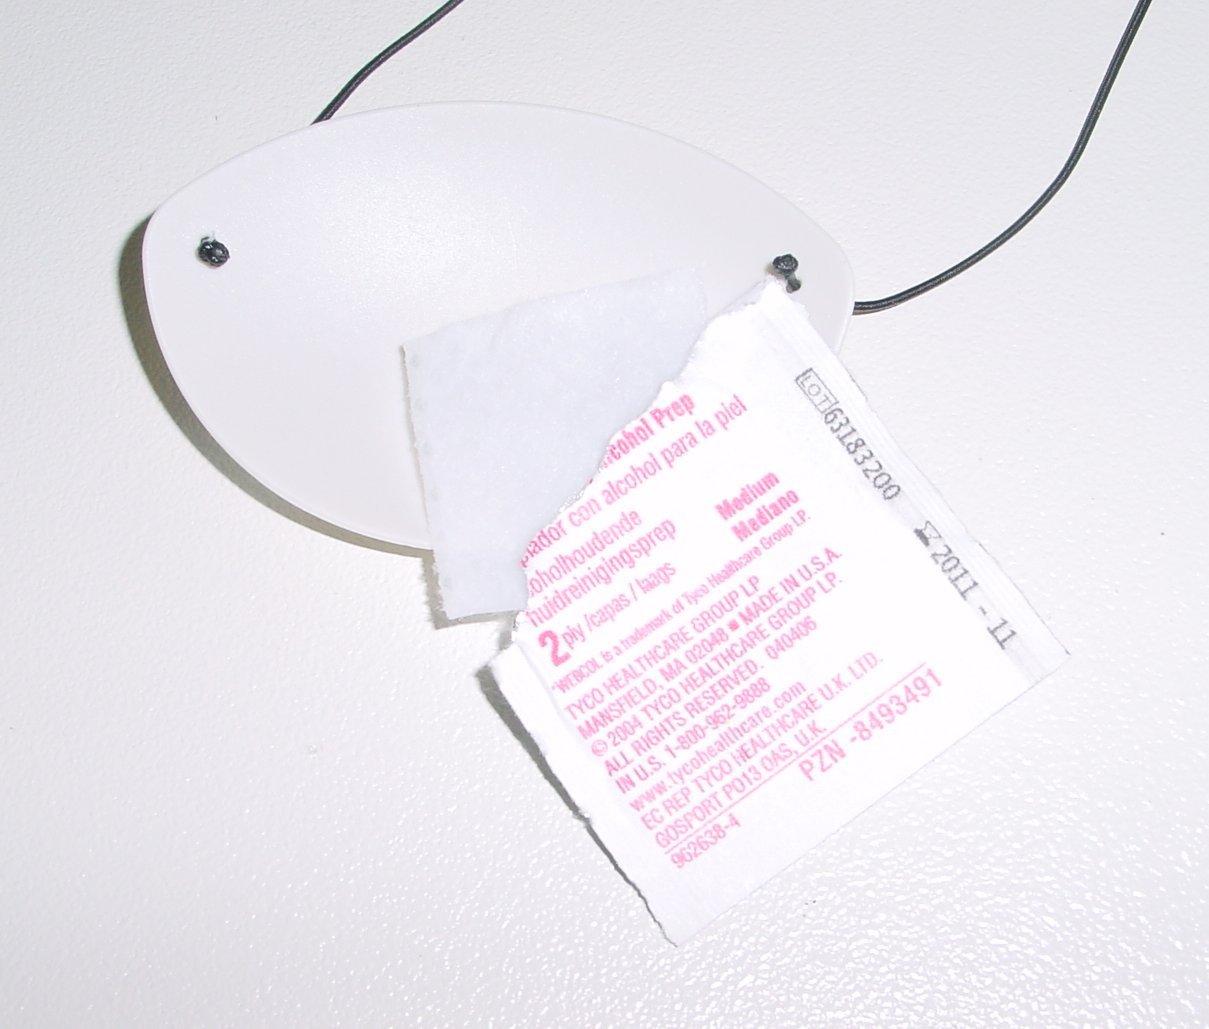
Disinfect the eye occluder, chinrest and headrest.
At the start of every new session, even if the patient is an experienced perimetry taker, instruct the patient as follows:
Static Perimetry
- Always look in the center of the green fixation target(s).
- Push the response button whenever you feel to have seen a light flashing up.
- Close the eye or keep the response button pushed if you need a break. The instrument continues the test as soon you open your eye and/or release the response button.
- Don't worry about making mistakes. It is normal that you won't see lights for some time during the test. As long as you hear buzzing sounds, the test is going on.
Goldmann Kinetic Perimetry
- Always look at the green fixation target.
- Push the response button whenever you see a light appearing (it may be a large and bright, but also a tiny little, barely visible light)
- Tell the examiner if you need a break or think you made a mistake.

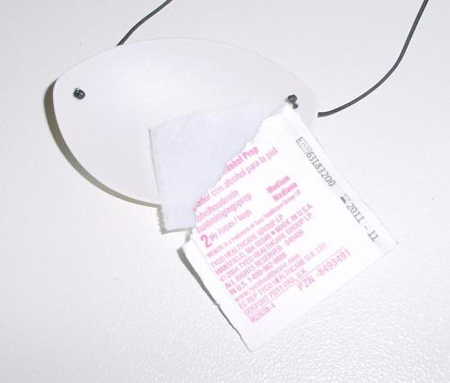
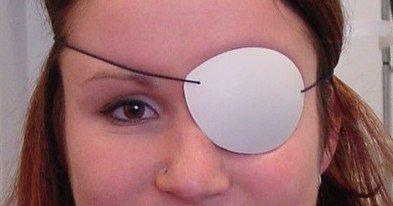
Cover the non-examined eye of the patient with a white, translucent eye occluder.
Refraction
When examining the central 30° in static and kinetic perimetry, you should correct the patients vision and add a near correction for presbyopia.
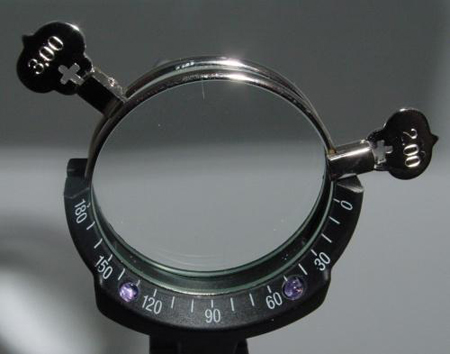
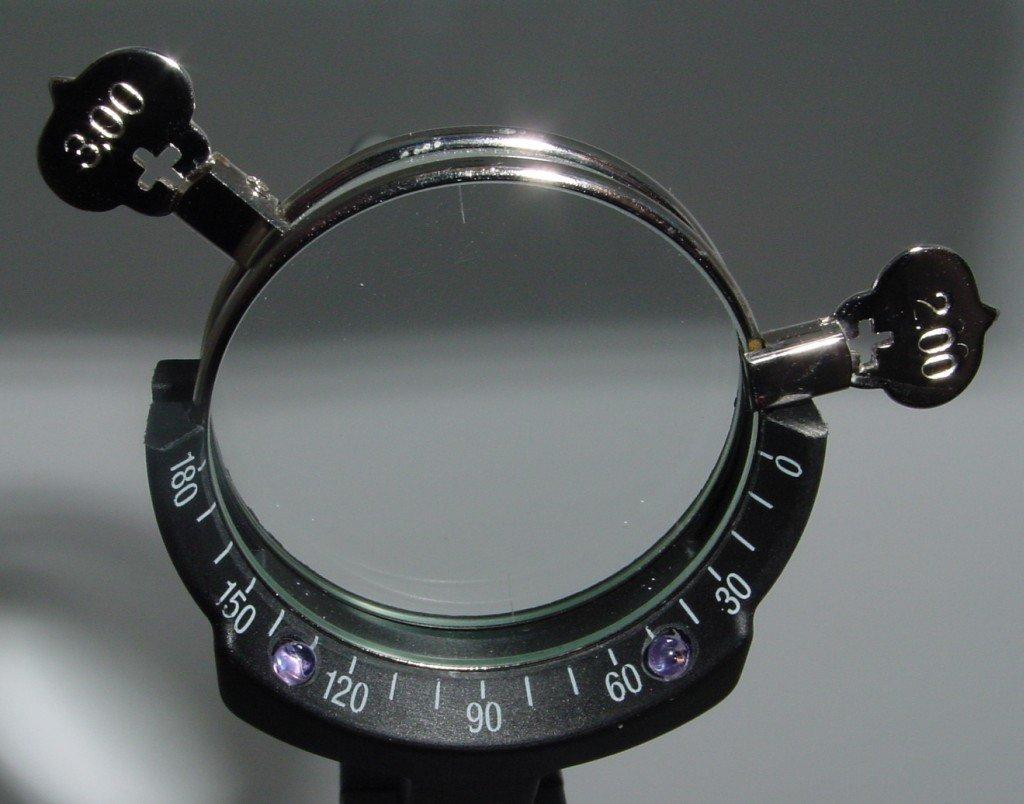
Check the patients refraction and add the below spherical near correction. Insert the lenses: Aspheric lens into the instrument, spheric lens to the eye.
Age
|
Correction
|
30 - 40
|
+1.0
|
40 - 45
|
+1.5
|
45 - 50
|
+2.0
|
50 - 55
|
+2.5
|
55 - 60
|
+3.0
|
> 60
|
+3.25
|
Note: Enter or change the refraction lens entries in the examination screen once you confirmed that the patient sees the fixation target well with this correction. Always use thin rim lenses as shown! 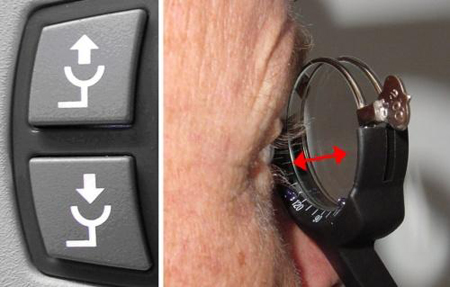
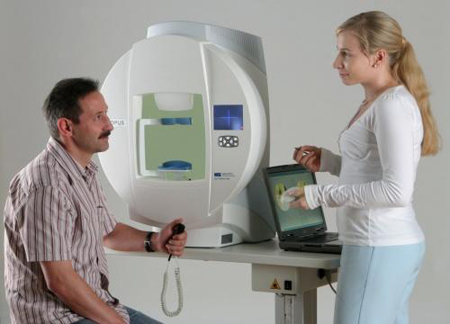
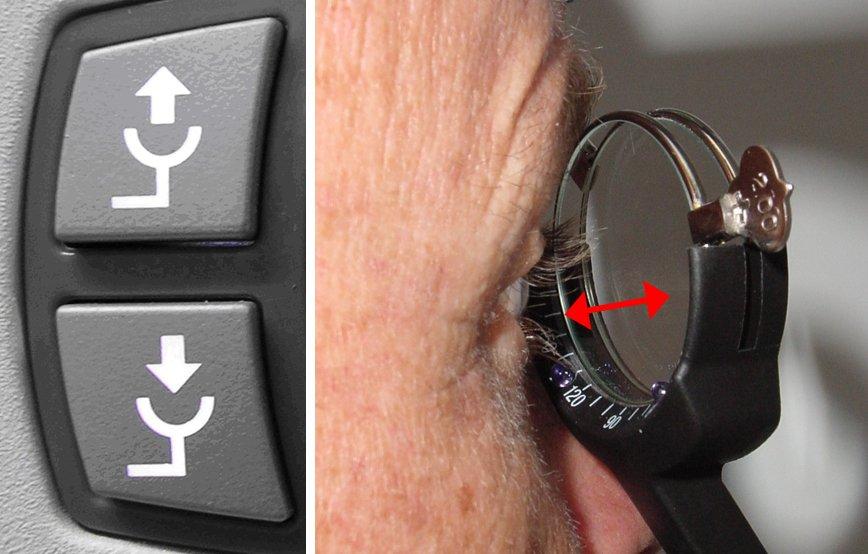
Seat the patient comfortably, the forehead touching the forehead rest and adjust the distance between eye and lens holder using the following buttons. The optimum distance is approximately 1.5 cm.
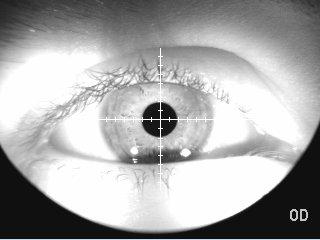
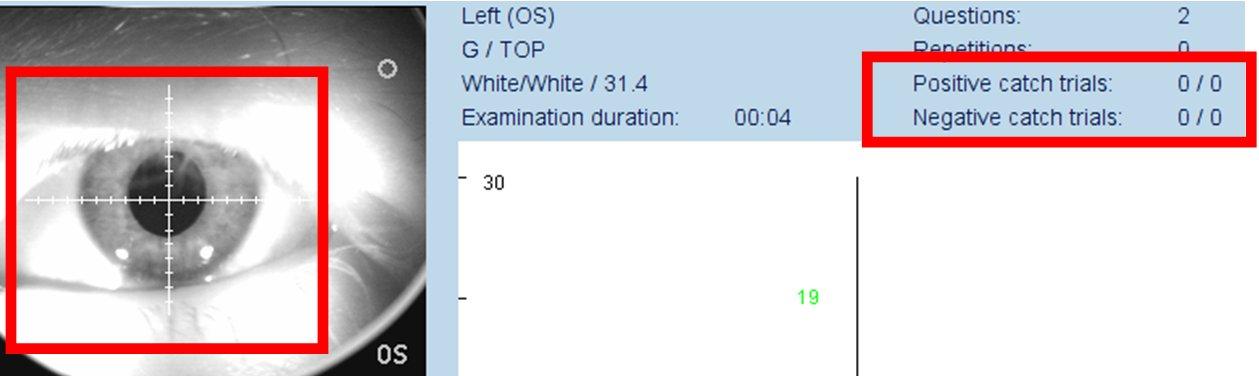
Adjust the position of the eye to be in the center of the reticule.
Controlling a Static Perimetry Test
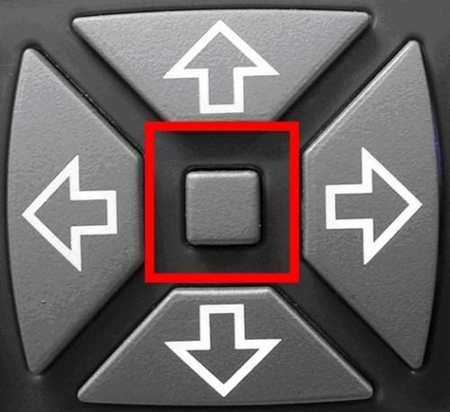
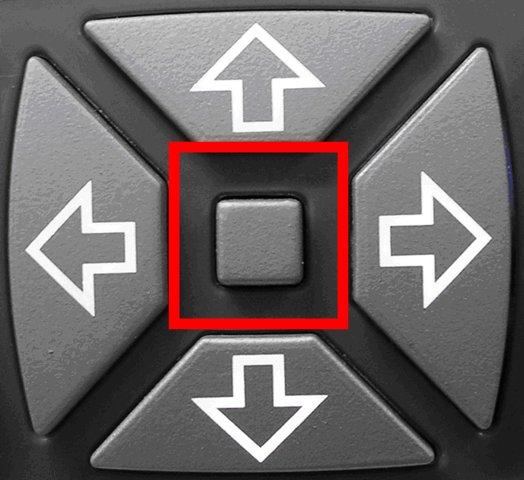
Push the center button to start the examination or click "Start" on the PC
- Readjust the patient if the pupil center deviates more than 3mm (lines) from the reticule center.
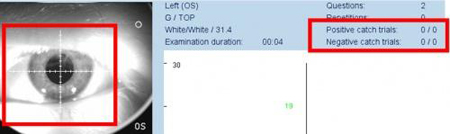
- Observe the catch trials until at least one positive and one negative catch trial have been shown (1st number: wrong answers; 2nd trials displayed)
- If the "positive catch trials" show 1/1 then hit "Stop", then "Restart", instruct the patient to only push the button if he/she has seen a light, readjust the eye position and "Start" again.
Examination Flow Optimization
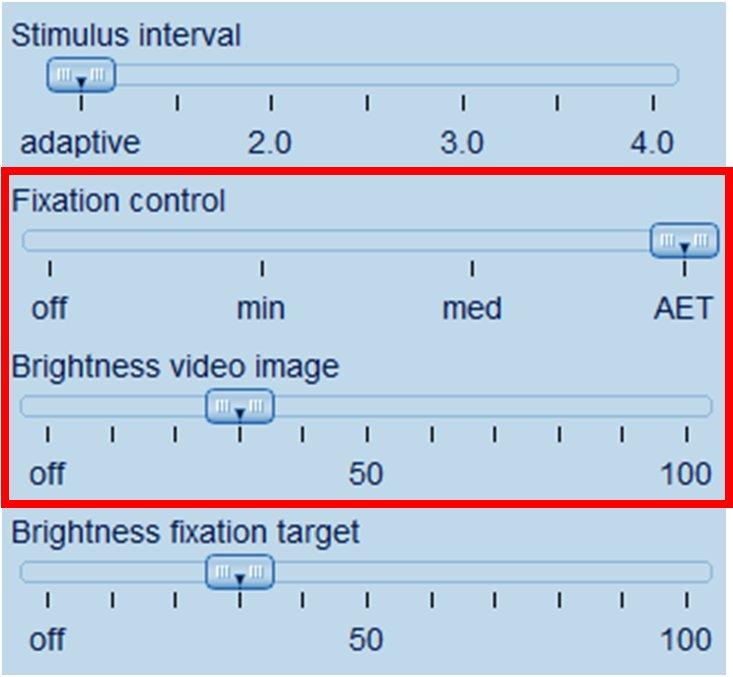
If the test is interrupted by a message "Please reposition the patient" for several seconds but the patient is seated and positioned well:
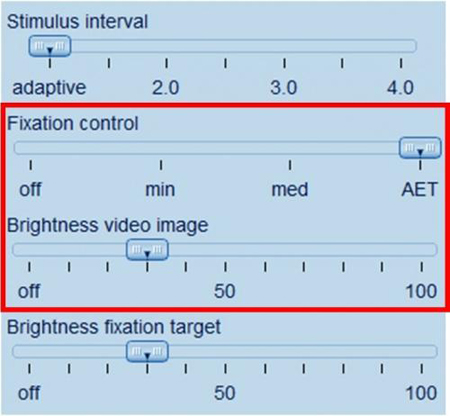
- Change the "Brightness video image" one position to the left or to the right. See if the message disappears.
- Move the "Fixation control" slider to "min". If this still doesn't help, move it to "off".
Distance Between Refractive Lens and Eye
Correct lens-to-eye distance of 15mm yields best results
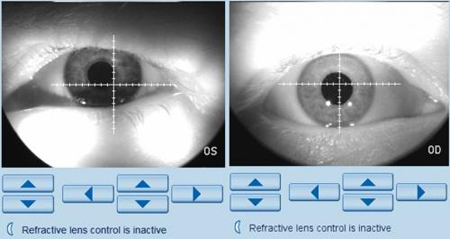
Left: Lens too close (Bright spots below), Right: Lens too far (Bright spot above the eye)
Controlling a Goldmann Kinetic Test
Automated kinetic test and automatic isopter drawing
- To start an automated test, click the "Play" button.
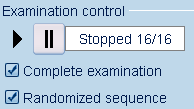
"Complete examination" will not stop between different isopters. Turning this option off allows you to instruct the patient, remove or insert a refractive lens and then continue.
"Randomized sequence" will show the vectors within the same isopter in random order, while turning the feature off will run the vectors in their programmed order.
- It is recommended that even during an automated examination the patient is supervised and motivated.
- Once the examination is finished, select the button "Draw new isopter"

- Click on a response icon, move towards the response you want to connect and double click between the response icons: This will automatically connect the isopter.
- Click the "Save" button to leave the examination window.
Elements and Parameters - Goldmann Kinetic Perimetry GKP
Vector Types
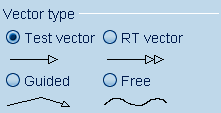
In the option "Automated Goldmann Kinetic" you find the 3 vector types
- Test vector: The vector type most commonly used
- RT (Reaction time) – Vector: A vector type used a few times during the test to calculate the patients average response time.
- Guided vector: A vector only used in special situations - e.g. to examine a nasal step - and by experienced users.
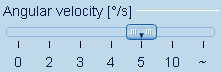
All these vectors run in a repeatable fashion with the "angular velocity" in °/sec predefined with this slide bar:

To present vectors (stimulus paths) you click on the start point, drag the mouse to the end point and release the mouse button. Right after releasing the mouse buttons, they are presented to the patient.

In the option "Manual Goldmann Kinetic" you find the vector type "Free". This is the direct replacement of the pantograph function in the Original Haag-Streit Goldmann perimeter.
If you click and drag the mouse, the stimulus in the perimeter will follow your mouse path. To facilitate constant velocities, the "angular velocity" (movement speed) is color coded.

0-1°/Sec black
2-3°/sec blue
4-7°/sec green
≥ 8°/sec red
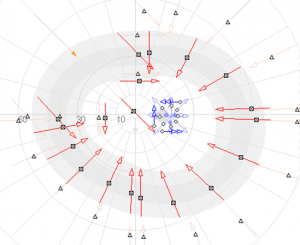
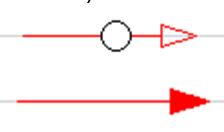
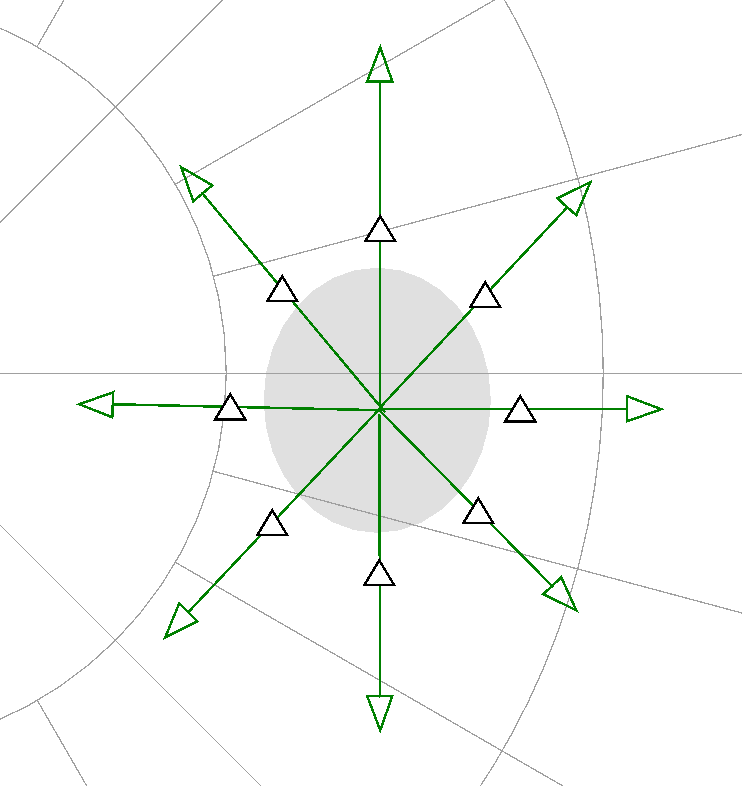
Regular responses are marked with an open icon, "No" responses have a filled arrow head.

Depending on the selected Goldmann parameters, the symbols may vary (circles, triangles, squares).
How to Create Automated Tests
You can either decide to save the vectors of a finished test in your test library or create a new test just by drawing vectors. If you want to create a test without actually examining a person, first click on the "Pause" icon
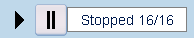
This will pause a test and prevent displaying stimuli while drawing vectors.
Draw all vectors that shall be tested.
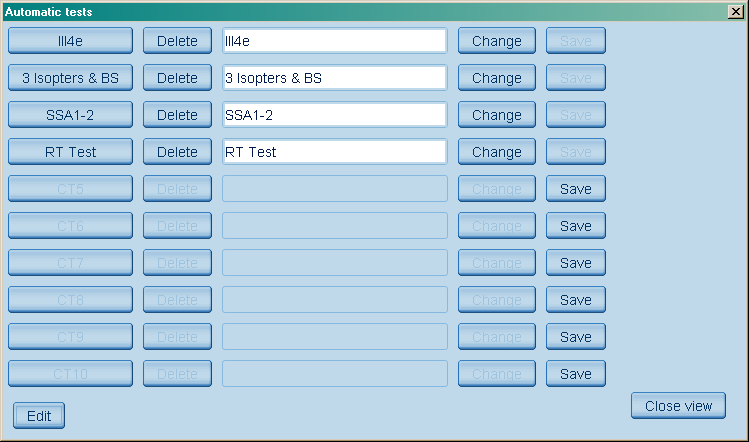
Click on the button "Automatic tests", then click the "Edit" button. The following window is shown:
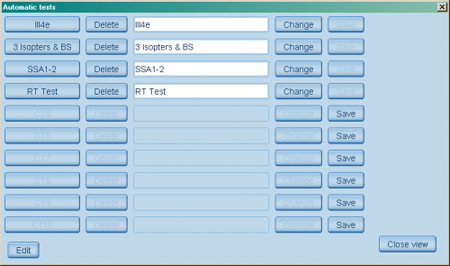
Save the test in the position of your choice, Name the test, then click "Change" to rename a test button
Delete old tests you want to remove from the library. Click "Close" once you saved / renamed the test.
Steps of Kinetic Examination
A kinetic examination is an interactive process between the examiner and the patient.
Most clinics have their own predefined and taught proceeding. The one we present here is our recommendation drawn as a conclusion from the many different proceedings we learnt from experienced manual Goldmann users. It includes the steps:
a) Confirm central fixation by establishing the blind spot
b) Establish the outer visual field borders
c) Complete the examination with additional isopters
d) Evaluate the result
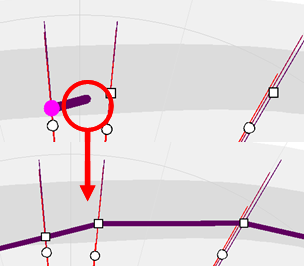
Blind spot testing, calculating isopter areas and rounding isopter connections
1. Click on the magnifying glass  to activate the zoom function. to activate the zoom function.
2. Click 3 times on the template of the blind spot
3. Choose the vector type "test vector"
4. Select the angular velocity to be 2°/second
5. Choose Stimulus size I (0,1° diameter)
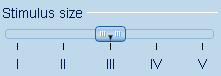
A note on stimulus sizes:
Size I / 1 is preferred for the blind spot, scotoma and the central visual field
Size III / 3 is preferred for the peripheral vision
Size V / 5 is preferred in end stage testing
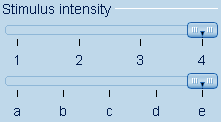
7. Choose the stimulus intensity to be 4e (0dB, maximum intensity for kinetic, corresponding to 1000asb)

1..4 are 5dB steps (e.g. 3e = 5dB)
a..e are 1dB steps (e.g. 3a = 9dB)
8. Click on the "Draw new vector" icon 
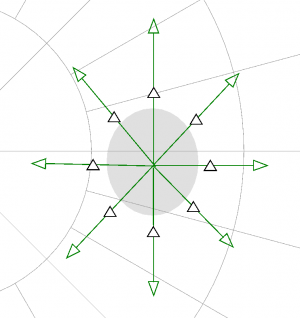
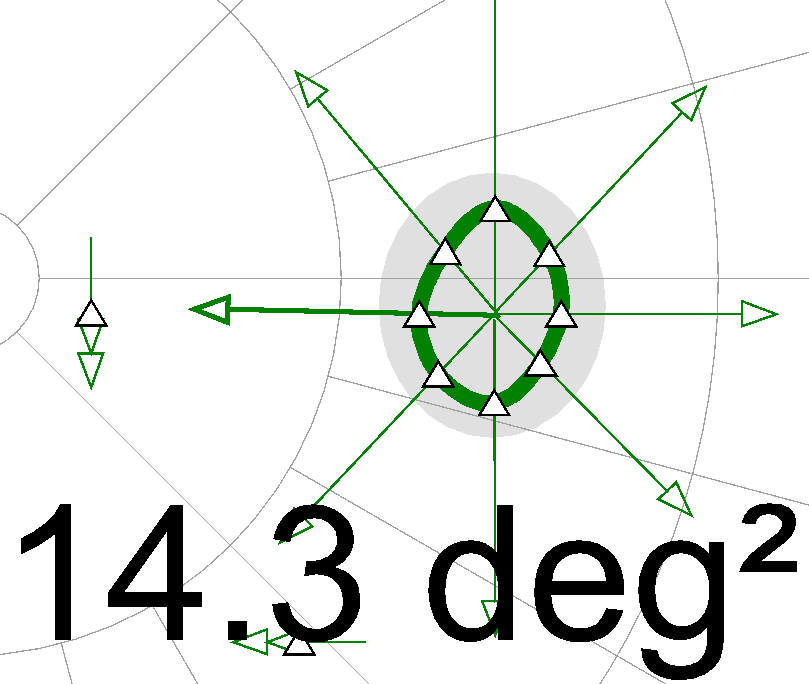
9. Always drag vectors from non-seeing to seeing areas. e.g. from inside the blind spot to well outside the blind spot:
10. Use the eraser icon  to delete and repeat vectors with very early responses. to delete and repeat vectors with very early responses.
11. From the supposed center based on the patient responses draw additional vectors to establish the size and shape of the blind spot
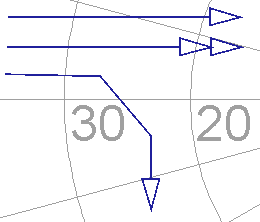
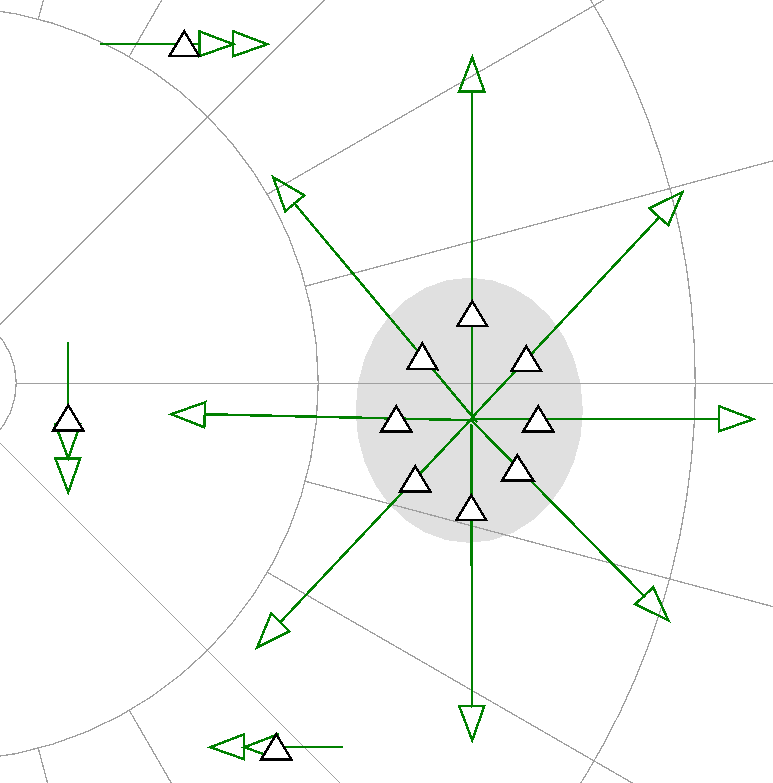
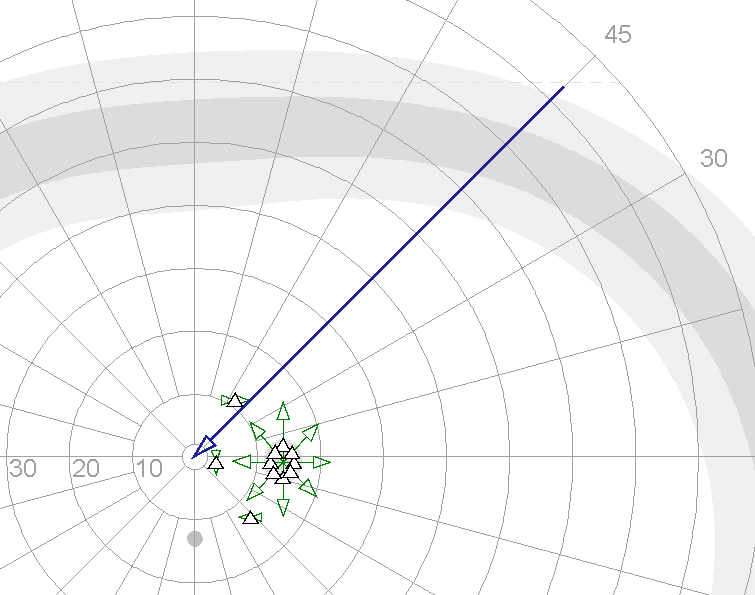
12. Switch to the vector type "RT-vector". You will now establish the patient's reaction time (the delay in his/her responses).
13. Draw 3 RT-vectors (double arrow head vectors) in areas that are considered seeing areas.
14. The distance between the start of the vector and the response corresponds with the reaction time. This delay time is calculated in milliseconds and can be used to correct the responses on regular vectors (patented feature). To correct for reaction time click on the RT icon 
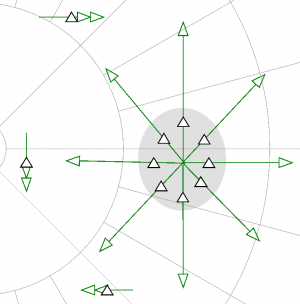
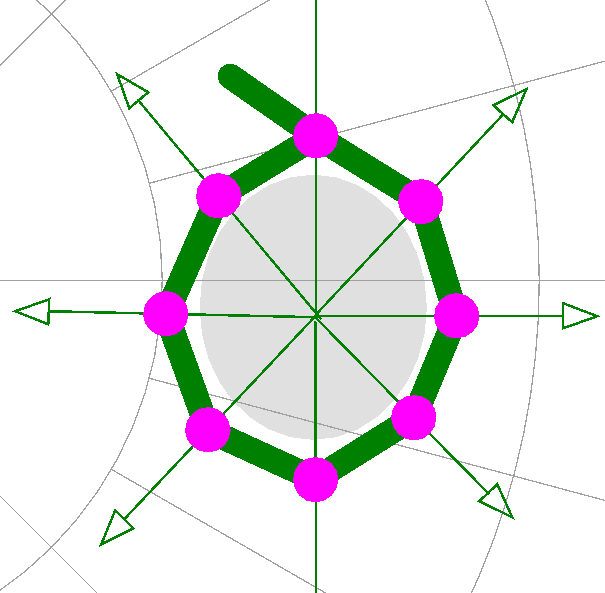
16. To connect an isopter manually, start by selecting the "Draw new isopter" button , then click consecutively on all responses you want to connect and last to the one you started with again.

17. With a right click you terminate the isopter connection
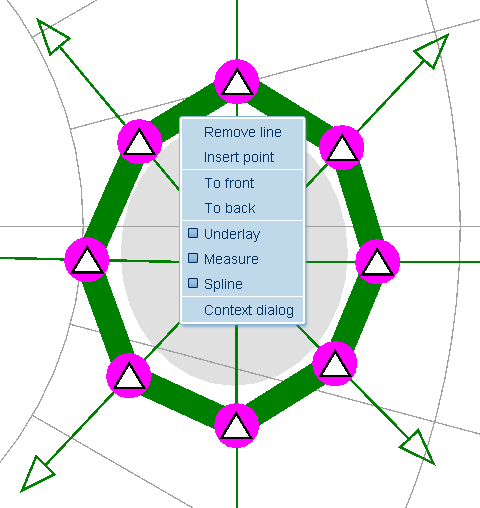
18. For all additional functions, right click on the isopter line; a context menu appears
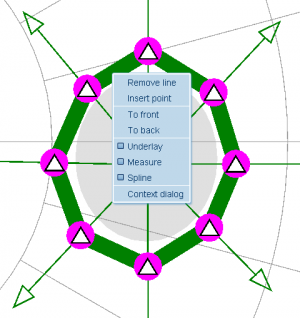
19. Spline switches to rounded isopters, measure will calculate the isopter area in degree square.
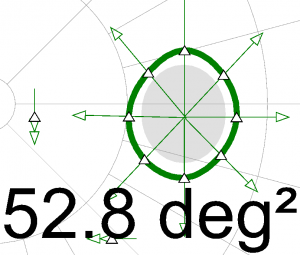
20. Turning on and off reaction time compensation will show you the influence on all responses and calculations.

Testing Peripheral Vision
1. Choose the vector type "test vector"
2. Select the angular velocity to be 5°/second
3. Choose Stimulus size III (0,43° diameter)
4. Choose the intensity 4e (0dB, maximum)
5. If a refractive lens has been used for blind spot testing, move the lens holder to its parking position now, using the lens holder down button.
6. Click on the start point from where the stimulus shall run towards the center
7. A single click will draw a vector that runs to the center. Click and drag will run from the location where you clicked to the location where you released the mouse button.

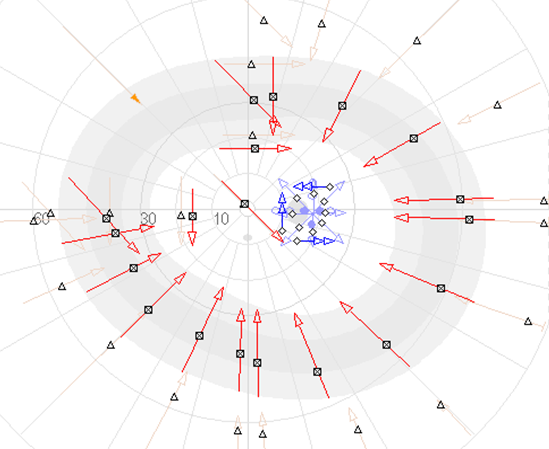
8. Run 8-12 vectors from the periphery and omit the vertical and horizontal midline.
9. Run another 8-12 vectors with the parameters stimulus size I, Intensity 3e.
10. Kinetic vectors should always enter seeing area perpendicular to the local visual field border. This provides the most accurate delimitation of islands of vision and of scotoma.
11. If you draw vectors in advance but then need to instruct or reposition the patient, you can pause and continue the vector sequence with these two buttons:
12. Normal value rings with 1 standard deviation (dark grey) and 2 standard deviations (light grey) are displayed to facilitate selecting reasonable start and endpoint locations for the vectors. To turn on and off the normal value template, click 
13. Start the vectors according to the responses and to the normal value rings usually slightly outside the normal value rings. This will reduce the examination duration and thus support the attentiveness of the patient.
14. If there are too many vectors on the screen to keep the overview, click the button  : All but the vectors with the actually chosen parameters are then hidden. : All but the vectors with the actually chosen parameters are then hidden.
Guidelines for General Kinetic Examination
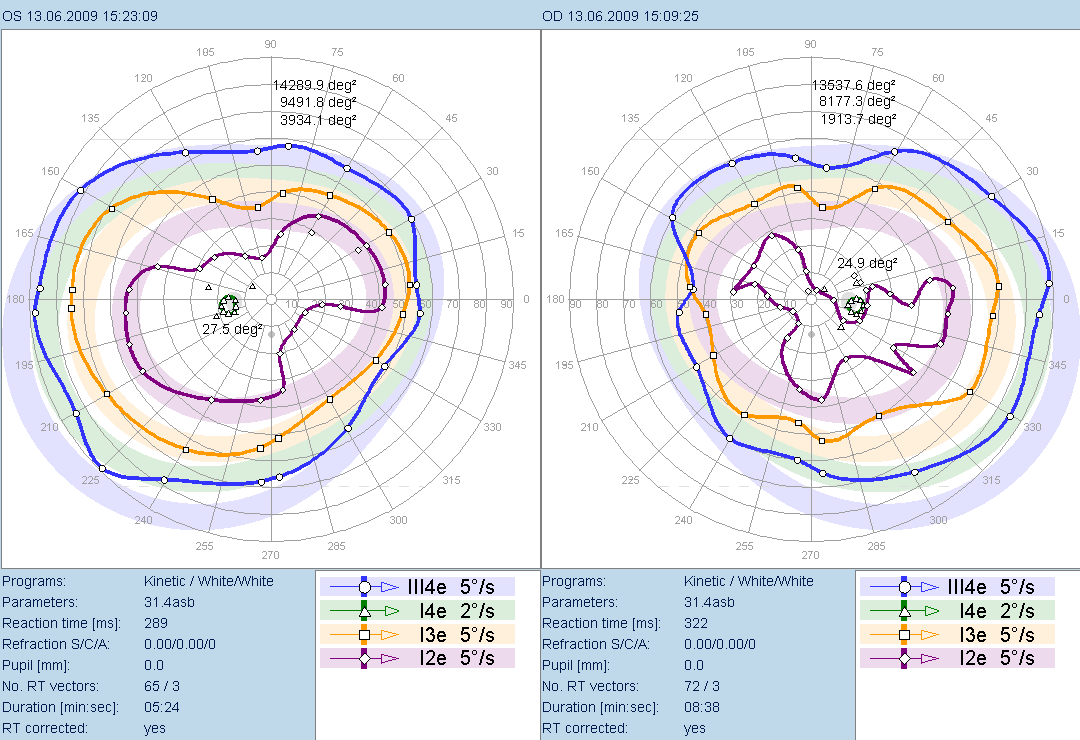
To conclude, a complete kinetic examination usually consists of:
a) Blind spot testing with I4e, 2°/sec
b) 1st isopter (ring) with III4e, 5°/sec
c) 2nd isopter with I3e, 5°/sec
d) optional 3rd isopter with I2e, 5°/sec
Choose the stimulus size and intensity to the patient's visual field defects.
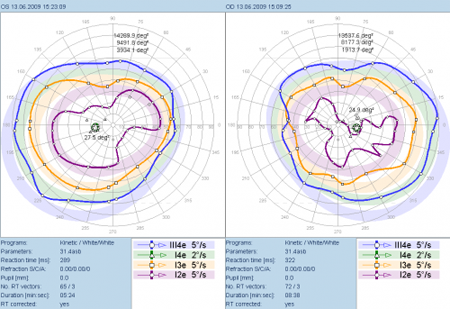
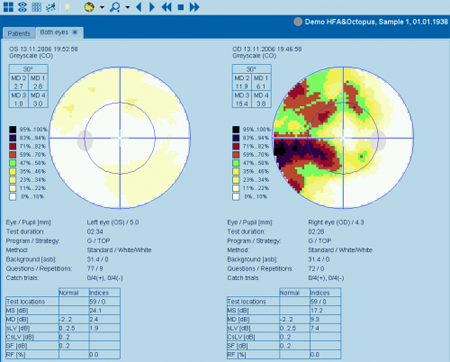
Example for the on-screen representation of two kinetic visual fields.
Evaluating and Printing Results
Visual Field Test Selection
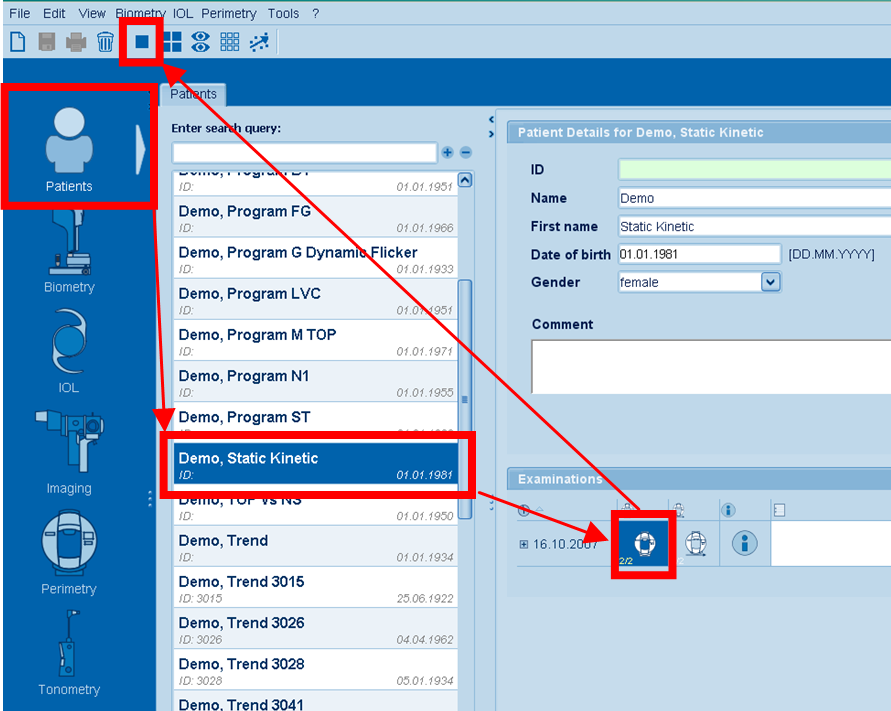
For viewing results and trend analysis, go to the Patients section.
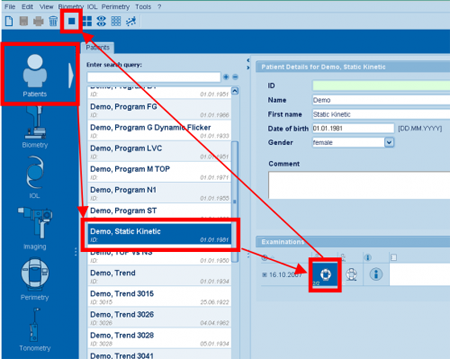
Select the patient. If you just performed an examination, the patient is already selected. If not, you can narrow the search by entering the first characters of the patient name in the field "Enter search query".
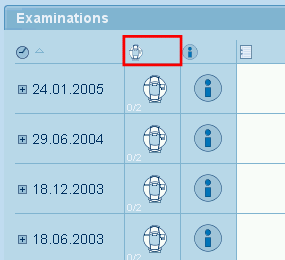
In the "Examinations" section select the tests to be analyzed.
For printing of results, the "Single field"  analysis provides the most flexibility. analysis provides the most flexibility.
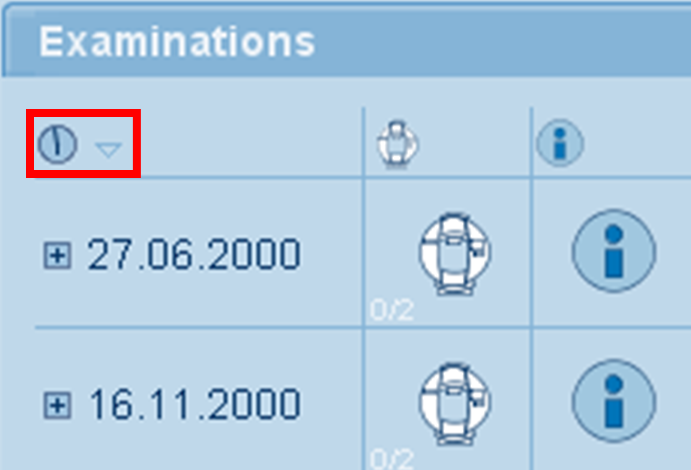
If you have multiple follow up examinations, you may want to make sure the latest exams are on top.
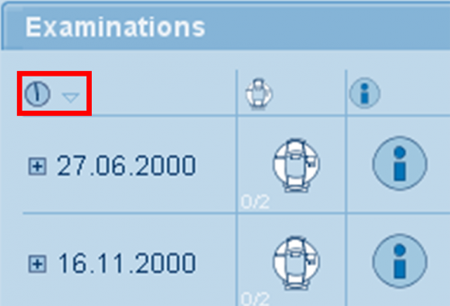
Clicking the watch icon changes the sorting direction.
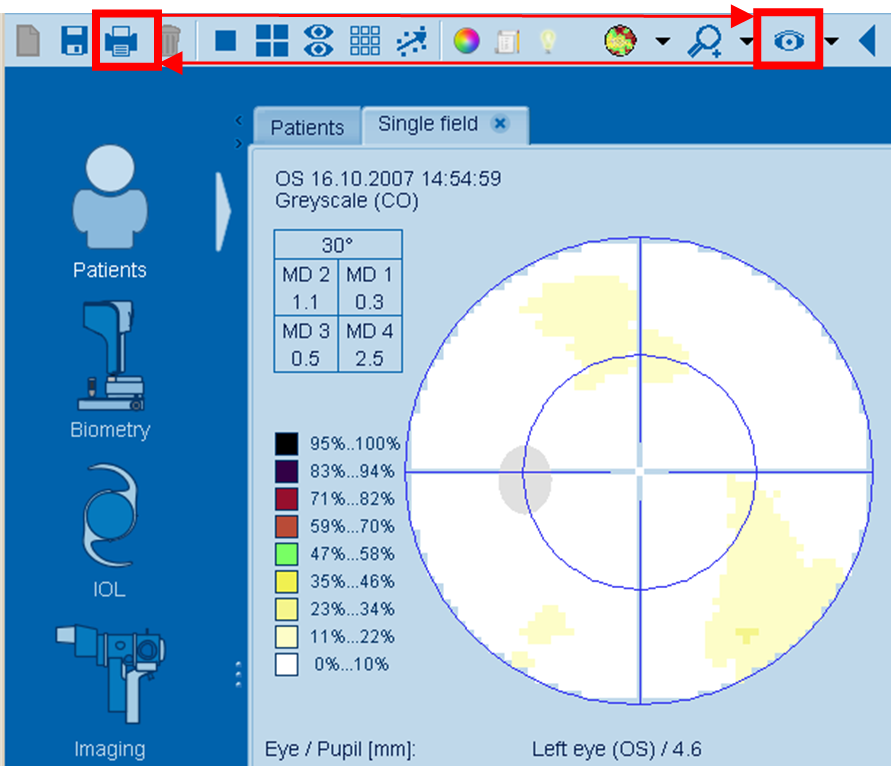
Printing
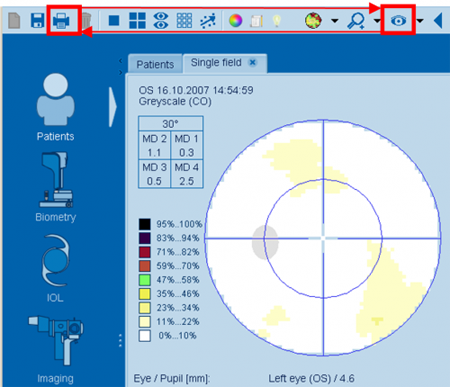
Click the print icon  and choose either "Standard printout" or select a printout from the list. and choose either "Standard printout" or select a printout from the list.
Switch to the other eye using the left/right eye icon  . .
Click the print icon again to select the printout of the second eye.
On Screen Analysis
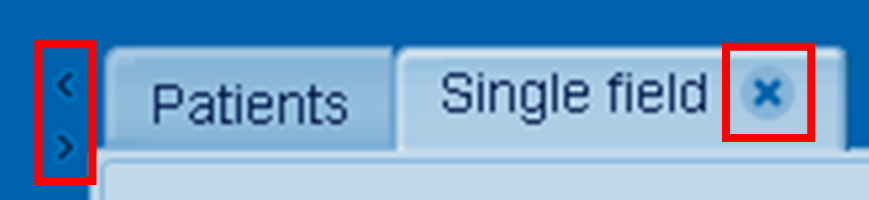
In order to maximize the space to display results, you can turn on and off the "Outlook bar" on the left side using the icons on the left.
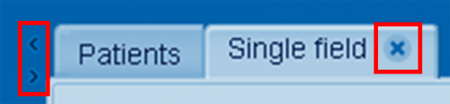
To move on to the next patient or just get back to the test selection, click the "X" icon.
Show one graph of one eye at a time (most flexible for printing results).
 Shows both eyes simultaneously. Shows both eyes simultaneously.
 Shows 4 preferred graphs of one visual field. Shows 4 preferred graphs of one visual field.
 Allows printing series. Allows printing series.
 Performs trend analysis. Performs trend analysis.
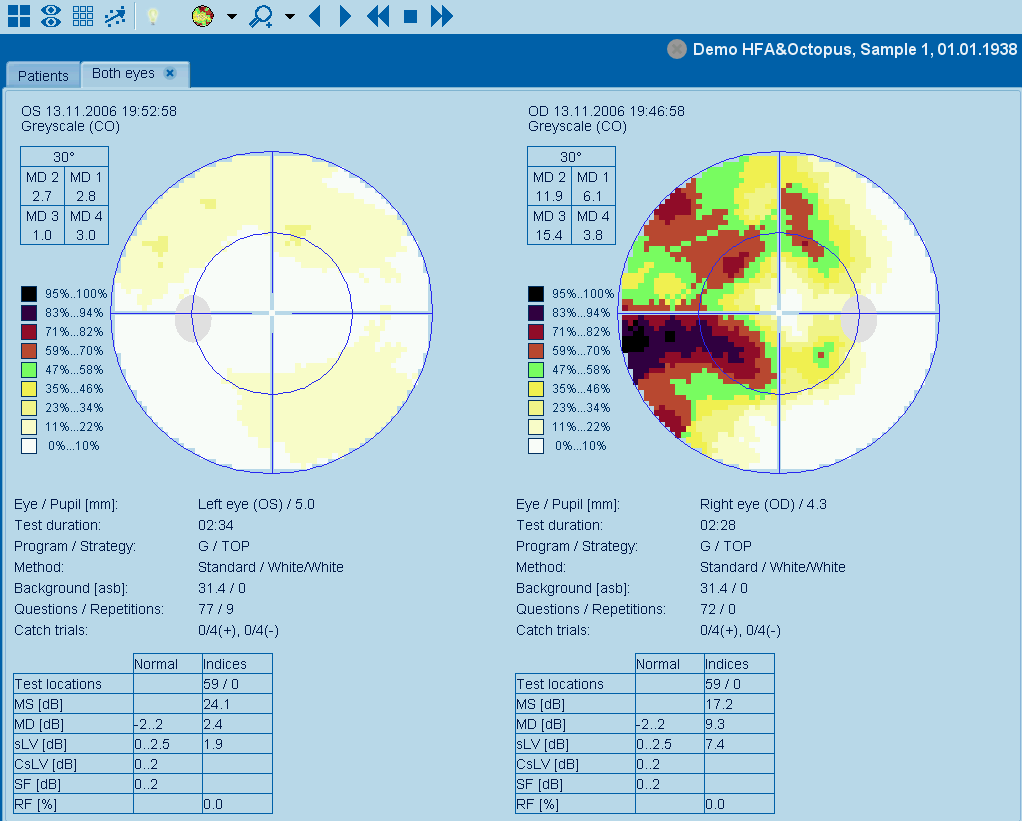
Single Field Analysis
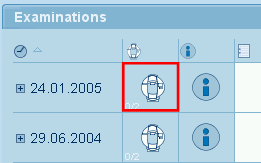
The fast lane to see both eyes is a double click on the icon of the respective examination(s)
This allows immediate judgement of both eyes and facilitates to recognize binocular issues and underlying neuro-ophthalmic conditions.
The default display is "Greyscale CO", it translates the deviation from normal into a percentage scale, where deviations up to about 3dB - normal areas - show as white, and more severe local deviations show as darker colors. Absolute defects are represented in black. The judgement thus is very simple: If everything is white or at you only see some single distributed light yellow spots on the otherwise white surface, the visual field is supposed to be normal.
To switch the representation to other graphs, click the icon 
"Type of representation".
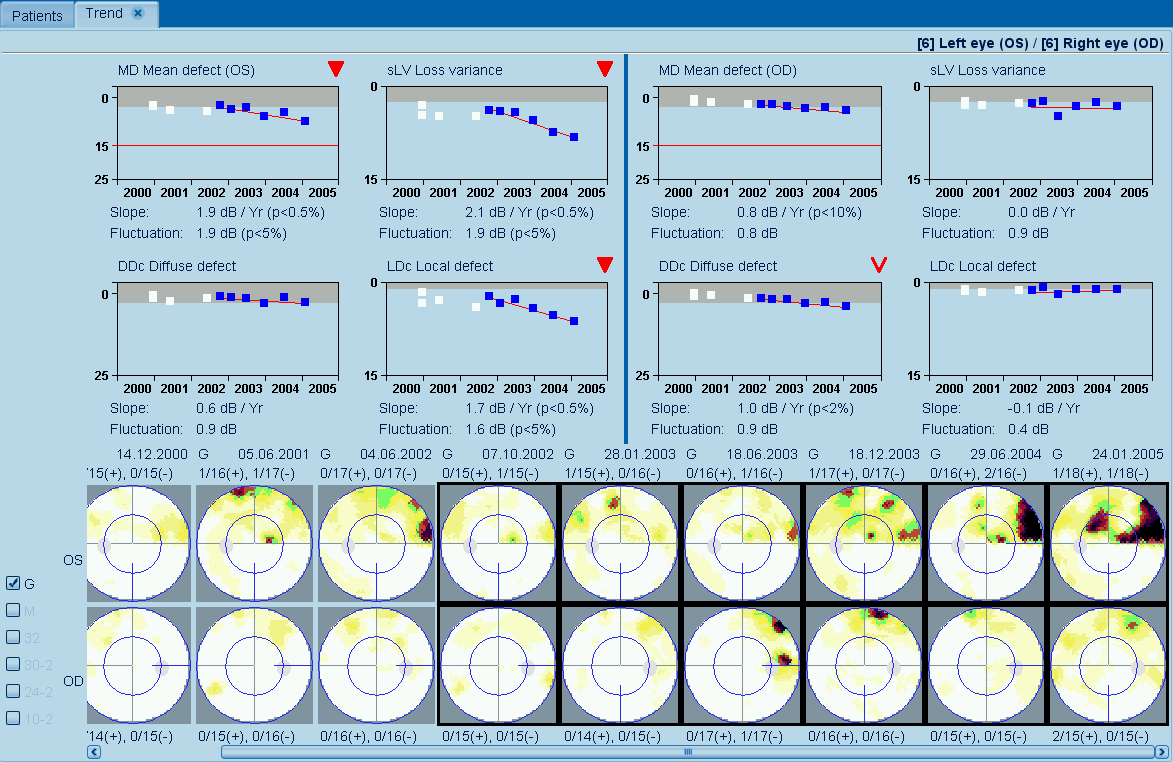
Trend Analysis (Evaluating the Rate of Progression)
A double click on the icon on top of the examination column directly opens the trend analysis window.
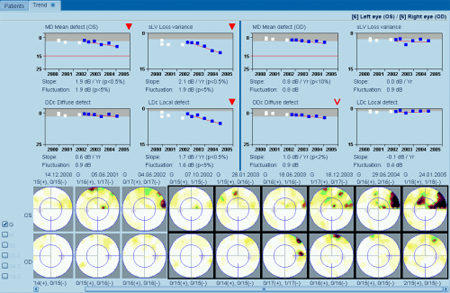
To analyze the rate of progression as recommended by the International Glaucoma Societies, first check if there is a red icon on top right of the "MD Mean Defect" graph. If so, the trend has statistical significance.
We recommend to take a look at the "Slope": This is the rate of progression in dB per year.
The red line indicates seriously impaired vision. The bottom line (25dB) indicates legal blindness (the exact definition varies according to the each country). If the defect goes below 25dB, the scale is automatically extended to 35dB.
In this example, the OS started to deviate from normal in 2002 with a rate of approximately 2dB/year. If a constant rate is assumed, seriously impaired vision would have been reached approximately after 7 years (2009) and monocular legal blindness approximately after 12 years (2014).
Icons - Statistical Probability Trends
EyeSuite Perimetry calculates population based levels of significance. The behavior of the actual patient is compared with the visual field series of patients who have stable (non-progressing) glaucoma according HRT optic disc analysis.
A probability of 5% means, that only 5% of this stable glaucoma population would exceed the respective measure but still be considered stable. More simply, a filled icon is a strong indicator for probable change, an open icon is a weak but still most of the time relevant indicator for probable change.
 Worsening at the 1% probability level Worsening at the 1% probability level
 Worsening at the 5% probability level Worsening at the 5% probability level
 Recovery at the 1% probability level Recovery at the 1% probability level
 Recovery at the 5% probability level Recovery at the 5% probability level
 Absolute Fluctuation at the 1% probability level Absolute Fluctuation at the 1% probability level
 Absolute Fluctuation at the 5% probability level Absolute Fluctuation at the 5% probability level
Increased fluctuation is an early indicator of upcoming changes and thus often precedes significant worsening.
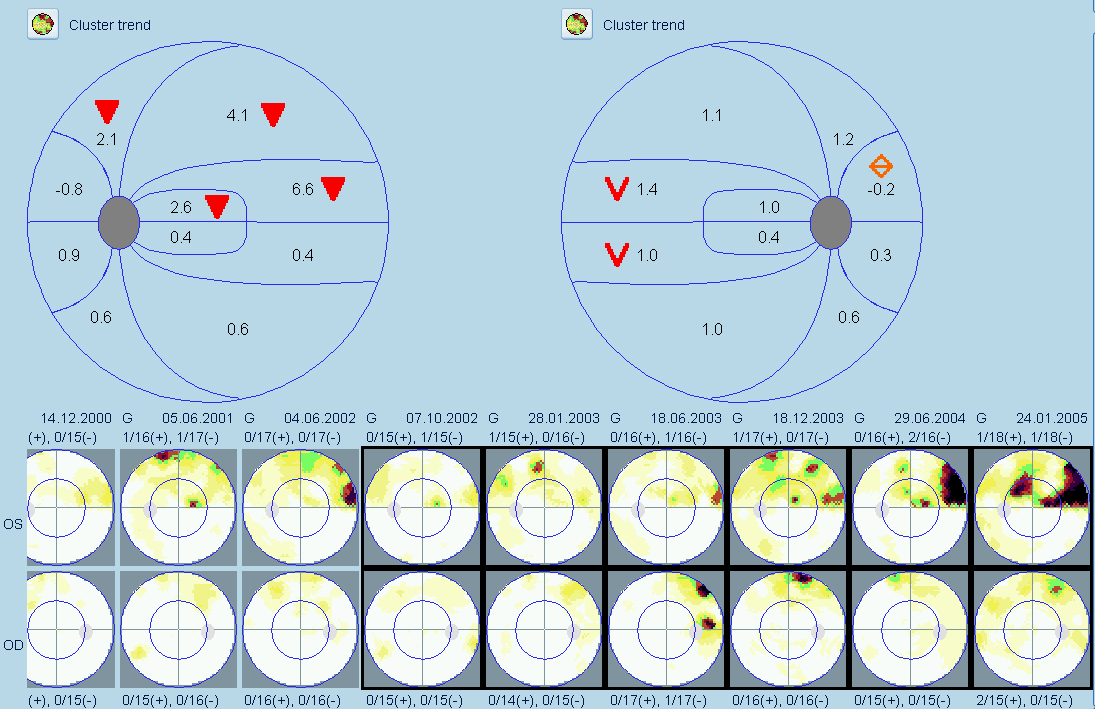
Cluster Trend and Polar Trend Analysis
In EyeSuite Perimetry Advanced and Pro, you additionally find trend analysis functions to analyze clusters (area of interests) and a structure function analysis.
To see these additional representations, click .
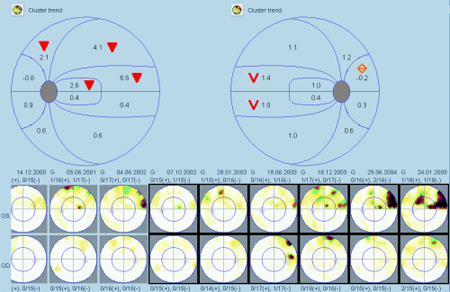
The number aside the probability icon represents the rate of change in dB per year. While the recommendation of the International Glaucoma Societies recommend looking at the rate of progression of MD, this graph in addition allows to judge the rate of progression in 10 different areas of the visual field. Since progression is concentrating on local regions most often, it is essential to learn if the affected regions are crucial for quality of life and if the regional rate of progression exceeds the global rate significantly.
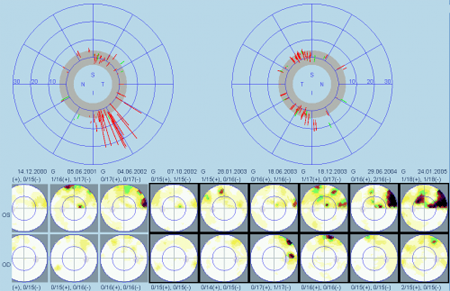
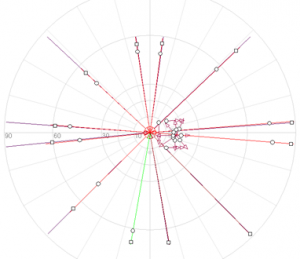
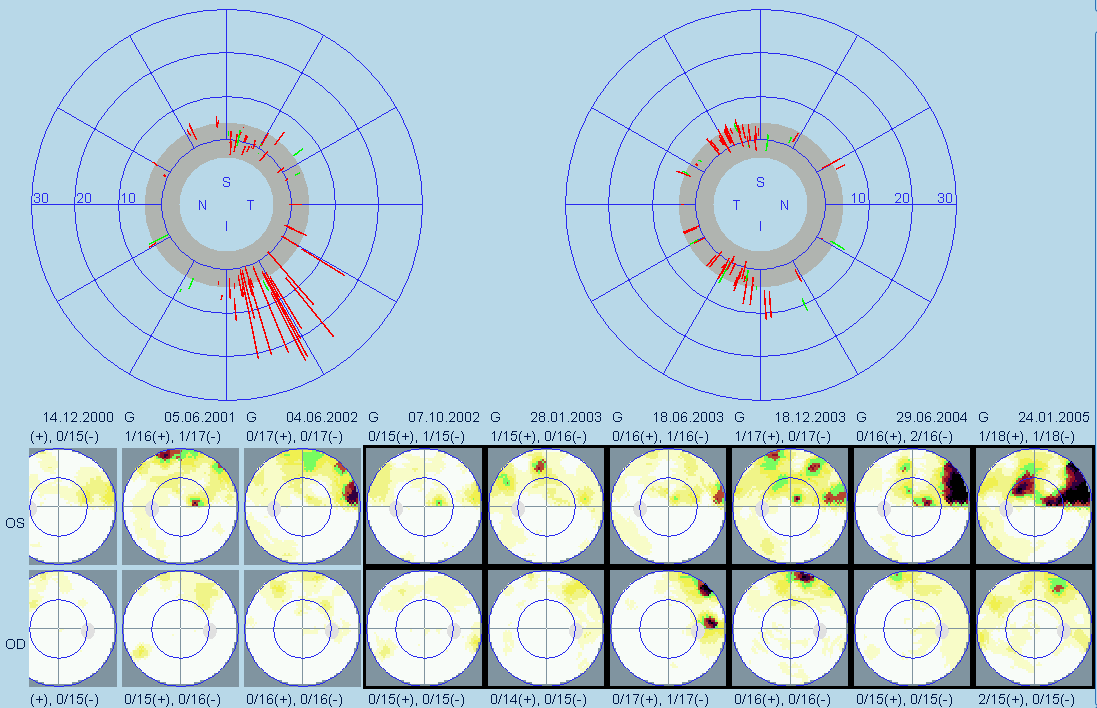
The Polar Trend analysis is a projection of each test locations (pointwise) linear regression analysis to the optic disc. The representation is the same as known from morphology (HRT, GDX, Fundus images etc.)
Red lines indicate test locations that are worsening. The start and endpoint of the red line represents the start and end levels of the local regression line in dB. Green lines show recovery.
The grey zone indicates normality, though even within normality, deviating nerve fiber bundles can be identified as a group of mostly red lines. The diagnostic power of such - even early - findings is improved if confirmed by morphology.
Export Format Tags (Placeholders)
For interfacing to EMR systems and for the statistical export, patient and test information can be combined and exported as files. For details see the section General Program Functions. A generic export file is included as default and can be applied for statistical export in the Pro version under "Perimetry", "Export examination data".
|
