Modulation Transfer Function (MTF)
For those who enjoy knowing how things work!
The modulation transfer function (MTF) is an optical bench measurement
used by engineers to evaluate the performance of a lens, or a lens
system. In its most basic sense, the MTF is a way to describe the
contrast sensitivity of a lens system. For the human eye, this could
be though of as its “visual performance.”
Modulation transfer is the ability of a lens system to transfer
an object's contrast to its image. Modulation is therefore
a ratio of image contrast to object contrast. Ideally, it would be
one, or 100%. Modulation transfer plots describe the modulation of
a lens system as the object increases in complexity. Therefore, the
Y-axis is modulation and the X-axis is spatial frequency, measured
in line pairs per millimeter. As you would expect, as the spatial
frequency increases, the modulation of any lens system decreases.
Outside of optical engineering, most are unfamiliar with the importance
of MTF because there are no easy ways to standardize it.

The most common way that MTF is explained is as an analogy to sound.
Just as in optical imaging, audio recordings do not perfectly duplicate
the original. A sound consists of many individual frequencies, or
pure tones, simultaneously reaching the ear. Two parameters characterize
a pure tone: the frequency, or tone, and the loudness, or volume. A
pure tone is typically represented by a sine wave. The horizontal
distance between peaks determines the frequency and a vertical distance
from peak to valley determines the volume. Of course, most sounds
are a mixture of many hundreds of different frequencies, each with
its own volume. This would be a complex sound. In much the same way,
an optical image is made up of many spacial frequencies and differing
amounts of contrast.
When a sound is recorded, each component frequency gets recorded,
but the process invariably changes the volume of each frequency.
The playback is a mixture of tones that constitute the original sound,
but usually at different volumes. This change in volume for a specific
tone causes the recorded sound to differ from the original. Likewise,
when an image is projected or recorded, the contrast is typically
differs from the original object by small or large amounts.
If a single pure tone is recorded, the frequency of the recording
matches the frequency of the original, but the recorded volume usually
changes. The ratio of the recorded volume to the original volume
would be the measured response of an audio system to that particular
frequency. If an audio system has different responses to different
frequencies, the recorded sound will not match the original. However,
if the audio system has the same response to all frequencies, the
recorded sound will duplicate the original sound. A graph of response
vs. frequency, known as a frequency response curve, is typically
constructed to show the fidelity, or frequency response of any audio
system. High-end audiophiles spend much of their time (and most of
their money) chasing this.
Optical images of any kind can be analyzed in much the same way.
The difficult part here is that the optical analogy of a pure tone
is a sine wave grating, or SWG. The frequency of the sine wave grating
is determined by the horizontal peak-to-peak distance. The sine wave
grating contrast is indicated by the difference in brightness between
the brightest and darkest points, and is analogous to the volume
of a tone. One difference between sound and optics is that SWGs also
have an orientation, which can be vertical, horizontal, or oblique.
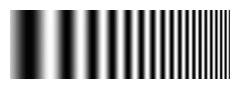
Unlike a sine wave grating, which gradually changes from dark to
light, another pattern, known as Ronchi rulings, change abruptly
and is instead is based on a square wave rather than a sine wave.
Snellen figures (the standard visual acuity eye chart) are essentially
Ronchi rulings. This is why Snellen acuity is such a poor way to
asses visual performance. Contrast sensitivity testing, using charts
that are basically SWGs, provides a more complete evaluation of visual
performance, but this is a more complicated test to administer and
is poorly understood by those outside of optics and ophthalmology,
such as insurance companies.

For a Ronchi rulings there are basically dark bars and light bars
and we can measure the amount of light coming from each. The maximum
amount of light will come from the light bars and the minimum from
the dark bars. If the light in a lens system is measured in terms
of transmittance (T) we can define modulation according to the following
equation:
Modulation = Mc = (Tmax - Tmin ) / (Tmax + Tmin)
where Tmax is the maximum transmittance of the grating and Tmin
is the minimum transmittance. When we look at the ratio of
the transmission from the light and dark bars, we are measuring
contrast. We can look at a sine wave grating in the same manner.
Now, let's assume that you have a sine wave grating of a specific
frequency (u) and modulation (contrast), and its image is passed
through a lens. The modulation of the image can now be measured.
The modulation transfer function at a specific frequency, MTF(u),
is defined as the modulation, Mi, of the image divided by the modulation
of the object, Mo, and is described by the following:
MTF(u) = Mi / Mc
The magnitude of MTF (u) versus u is typically what is plotted and
what you will see on MTF graphs.
Now back to the audio analogy. Just as a typical sound is
a mixture of many pure frequencies, optical images are also mixtures
of many SWGs. The image of a single SWG has the same frequency and
orientation as the original SWG, but the contrast is always decreased.
The ratio of the image SWG contrast and the object SWG contrast is
the transfer factor. The transfer factor is always between 0 and
1 and different frequencies have different transfer factors. The
graph of transfer factor vs. frequency is the modulation transfer
function and is analogous to the frequency response curve of an audio
system.
The MTF of an ideal optical system (one with no loss of contrast,
or detail) would be a horizontal line. Of course, this is impossible
to achieve. At some point, the MTF becomes 0; which is known as the
cutoff frequency. A SWG with a frequency exceeding the cutoff will
image as uniform gray, with no variation in contrast. In other words,
SWGs with frequencies above the cutoff do not appear in the image.
SWGs with frequencies below the cutoff appear in the image, but at
reduced contrast when compared to the original. The cutoff frequency
roughly corresponds to the resolution. The MTF gives a more
complete evaluation of optical performance than resolution, but it
is harder to measure and interpret.
 |
|
The human eye can be thought of in the same way as any optical system,
with two basic components: the cornea and the lens. The cornea is
an optical structure with positive spherical aberration and the lens
is an optical structure with negative spherical aberration. The lens,
with its negative spherical aberration greatly reduces the effect
of the positive spherical aberration of the cornea.
Intraocular lenses used in ophthalmic surgery are generally spherical,
are made of either silicone or plastic and have a single index of
refraction. They are also not generally aspheric, and as such produce
positive spherical aberration due to the fact that pencils of light
traveling through the visual axis (known as paraxial rays) are bent
less than those that travel through an area away from the visual
axis (known as marginal rays).
The greater the power of a spherical intraocular lens, the more
spherical aberration it will produce. And the more the spherical
aberration, the more the MTF is degraded, almost like unwanted noise
in a poor quality sound recording. With an intraocular lens of a
non-physiologic power, such as +35.00 diopters, there is an increase
in spherical aberration on the order of the square of each doubling
of diopteric strength. This means that there is roughly four
times as much spherical aberration for a +35.00 diopter intraocular
lens as there would be at an intraocular lens implant power of +17.50
diopters. 
As stated above, the difference between the bending of paraxial
rays and the marginal rays is the amount of either positive or negative
spherical aberration. The human cornea has naturally occurring positive
spherical aberration and the human lens as naturally occurring negative
spherical aberration. The net result is that these two structures
together produce an optical system with a very low amount of positive
spherical aberration. But if an older style spherical intraocular
lens is implanted (which has positive spherical aberration) this
increases the total amount of spherical aberration and degrades the
image quality at larger pupil sizes.
Overall, improving the modulation transfer function of the human
eye represents an attempt to achieve the best possible visual experience.
The newest generation of intraocular lenses, such as the IQ lens
attempt to do this based on the above scientific principles.
The eye specialists of East Valley Ophthalmology perform advanced
technology diagnostic testing and treatment, as well as taking
the time necessary to provide each patient with information needed
to fully understand their condition and to achieve their best possible
visual outcome.
If you would like further information, please call our office at:
480-981-6111
East Valley Ophthalmology
Eye Doctors - Mesa, ArizonaIf you or a family member
or friend have not had a recent routine eye examination, have a specific eye condition that needs addressing, or are looking for
an eye specialist or professional eye consultant please take a moment to Request an Appointment.
|
