|
IOLMaster — Axial Length Measurements
Signal-to-Noise Ratio (SNR).
Frequently Asked Questions:
(Data used with permission, courtesy of Dr. W. Haigis, University Wuezburg,
Germany)
1) When looking at the composite signal's SNR, is a HIGHER
value better than a lower value?
In principle, the higher the SNR, the better
the signal quality – up to a limit. An SNR above 2.0 for the composite
signal is sufficient for a good signal quality. Significantly higher levels
(e.g., SNR=100) or extremely high levels (e.g., SNR=1000) do not provide
appreciably better results.
2) How is the composite SNR calculated?
SNR is
calculated as signal amplitude divided by noise amplitude of the composite
signal.
3) Is there a range of "good" or "bad" composite
SNR?
In Version 4, our target was to get above 2. Correct, a good quality
signal has an SNR above 2.0. This is still the threshold for single measurements
as well as for the new composite signal in Advanced Technology Software Version
5. As long as the SNR is above 2, you will have a very good composite signal.
It does not matter whether the composite SNR is 100, 200, 400, or 1000. The
SNR value itself is not enough to determine which is better. Concentrate
on the composite signal's shape. Does it have a clear single peak?
The limits for borderline values are still 1.5 for a single measurement and
1.6 for the composite signal.
4) After a couple of axial length (AL) measurements
have been performed that result in fair SNR readings, the composite signal
shows a high SNR. This high SNR can be increased by an additional measurement
that showed an “Error” warning, instead of an AL value. Why does
an "Error" AL reading contribute to a higher composite SNR?
The “Error” warning
is displayed instead of an AL value when the SNR is below 1.5, but a low
SNR signal can contain significant information (i.e., significant signal
reflection from the retina) that is lost in the noise. This is why Advanced
Technology Software Version 5 with its composite analysis is so powerful.
Noise is a random process, and statistically it will cancel out in the composite
signal. In contrast, the main peak will be higher in the composite because
even a tiny peak, otherwise lost in the noise, will contribute to the primary
peak in the composite signal. Do not worry about SNR values or “Error” warnings
(SNR<1.5) on single measurements, but concentrate on the composite signal.
Do not delete single measurements (even those with the “Error” warning)
because even a noisy signal can contribute significantly to the composite
signal. Especially on a really dense cataract eye, you will never receive
an AL on a single measurement. You will most likely receive only “Error” warnings,
as the SNR is far below 1.5. With the composite signal, however, the system
will often be able to determine the AL.
5) Why in some cases is the composite
signal's SNR, analyzed from 5 AL measurements, lower than the composite
signal's SNR, analyzed from 2 AL measurements? Shouldn't the
composite signal's SNR increase with each additional measurement?
The
composite signal analysis algorithm was designed and optimized to extract
AL information from very low SNR signals and to process an evaluable composite
signal with acceptable SNR from low SNR single signals. For high SNR signals,
the algorithm is not linear. If you add high SNR measurements to already
high existing ones, the composite SNR does not necessarily increase. Usually
additional noise will be added, as all 2 measurements are subject to statistical
fluctuations. Consequently, there will be a small deviation between the AL
values in repeated measurements that will broaden the narrow AL signal peak
and lead to a lower SNR. Only in cases where you hit exactly the same spot
for each individual measurement will you receive an extremely high SNR of
more than a 1000. A high composite SNR (green traffic light) is sufficient.
On a really dense cataract eye any composite SNR above 2.0 should be considered
good.
6) I noticed that V5 is slower than V4 in AL measurement. Why?
Advanced
Technology Software Version 5 performs signal processing while measuring.
This processing includes: Noise filtering of the single measurement signal
before it is added to the composite signal. Calculation of the new composite
signal (including the last measurement).
7) Have the AL readings between
V4 and V5 been compared in a study?
Yes, Prof. Haigis presented the results
of his “Advanced vs standard signal analysis IOLMaster” comparison
at the ESCRS 2007. Please refer to Slide 3 of the presentation
of Dr. Haigis at ESCRS 2007.
8) Has the accuracy of K measurements obtained
with V4 and V5 been compared in a study?
Please refer to the presentation
of Dr. Haigis at ESCRS 2007,
Slides 11 through 14.
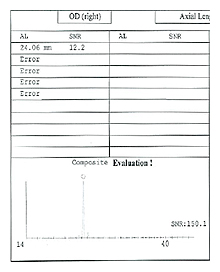
9) Five AL measurements have been performed. One shows an AL value with
an SNR of 12.2, but 4 show the “Error” warning. Although the composite
signal has an SNR of 150.1, an “Evaluation!” warning is shown
instead of an AL value, and no AL is transferred to the IOL power calculation
dialog. What is going on?
Advanced Technology Software Version 5 has a safety
mechanism. As long as only one measurement contains significant information
about the AL, the software does not show or provide an AL value for further
calculation. The “Evaluation!” warning appears instead. Of course,
the software is calculating the composite graph and shows an SNR.
This scenario
is unlikely to happen when measuring a patient's eye. In the example above,
measurements on different objects were added to the measurement on the
patient's eye to achieve the error condition 3
10) I did AL measurements of my eye
on two separate IOLMasters with Advanced Technology Software V5. Measurement
with both instruments resulted in the same AL but different composite SNR.
Is there anything wrong with the IOLMaster that showed lower composite SNR?
Not necessarily. All measurements are subject to statistical fluctuations.
Only if you hit the same spot on the retina in exactly the same angle will
you get the same SNR reading. This is very difficult to do on a patient's
eye, as the patient is not always fixating properly (e.g., because of micro
saccades).
11) A couple of AL readings were printed in "RED" and
the “multiple peaks” warning was shown. I deleted them, and the
composite value sometimes changed, and sometimes it remained unchanged. Why?
As long as the composite signal contains any significant AL information,
each single measurement AL (if available) is compared with the composite
AL. Outliers, which differ more than 0.05 mm, are printed in RED and the
warning “multiple peaks” is shown if there is at least one outlier.
An outlier measurement still can contain information on the "correct" peak
as well as the “outlier” peak. Do not delete measurements, even
those printed in RED. Instead, take a closer look at the composite signal
and the composite peak's shape ("Chrysler Building" single peak
or "Sears Tower antennas" double peak).
Go through the single measurements
and and try to determine which peak is the correct one, especially if the
composite peak's shape is like the "Sears Tower antennas" double
peak. If possible, perform additional measurements. If necessary, move the
measurement cursor (circle) to the correct peak on the blue composite graph.
The AL measurement for the other eye may help you decide which is the correct
peak.
12) What are the guidelines for best practice with the Advanced Technology
Software Version 5 and its composite signal?
- A good composite signal has
a SNR above 2.0.
- A borderline value is between 1.6 and 2.0.
- Below 1.6 no
AL is displayed.
Take a closer look at the composite signal peak's shape
("Chrysler Building" single peak or "Sears Tower antennas" double
peak), especially if the warning "multiple peaks" is shown. Go
through the single measurements and try to determine which peak is the correct
one, especially if the composite peak's shape is like the "Sears Tower
antennas" double peak. If possible, perform additional measurements.
If necessary, move the measurement cursor (circle) to the correct peak on
the blue composite graph. The AL measurement for the other eye may help you
decide which is the correct peak.
Do not delete single measurements because
they are identified as outliers (AL is printed in RED) or have low SNR
(“Error” warning).
The reason is that the software already recognized them as outliers and
has printed the AL in RED. Even a low SNR signal may contain significant
information for the correct AL. That is the rationale for using the composite
signal.
The IOLMaster with software version 4 requires five measurements to be taken.
The number of measurements is crucial. After the fifth measurement, if the
individual axial lengths are consistent, IOLMaster calculates the arithmetic
mean value, and passes it on for use in the IOL calculation, which enables
an evaluation.
|